Lumex
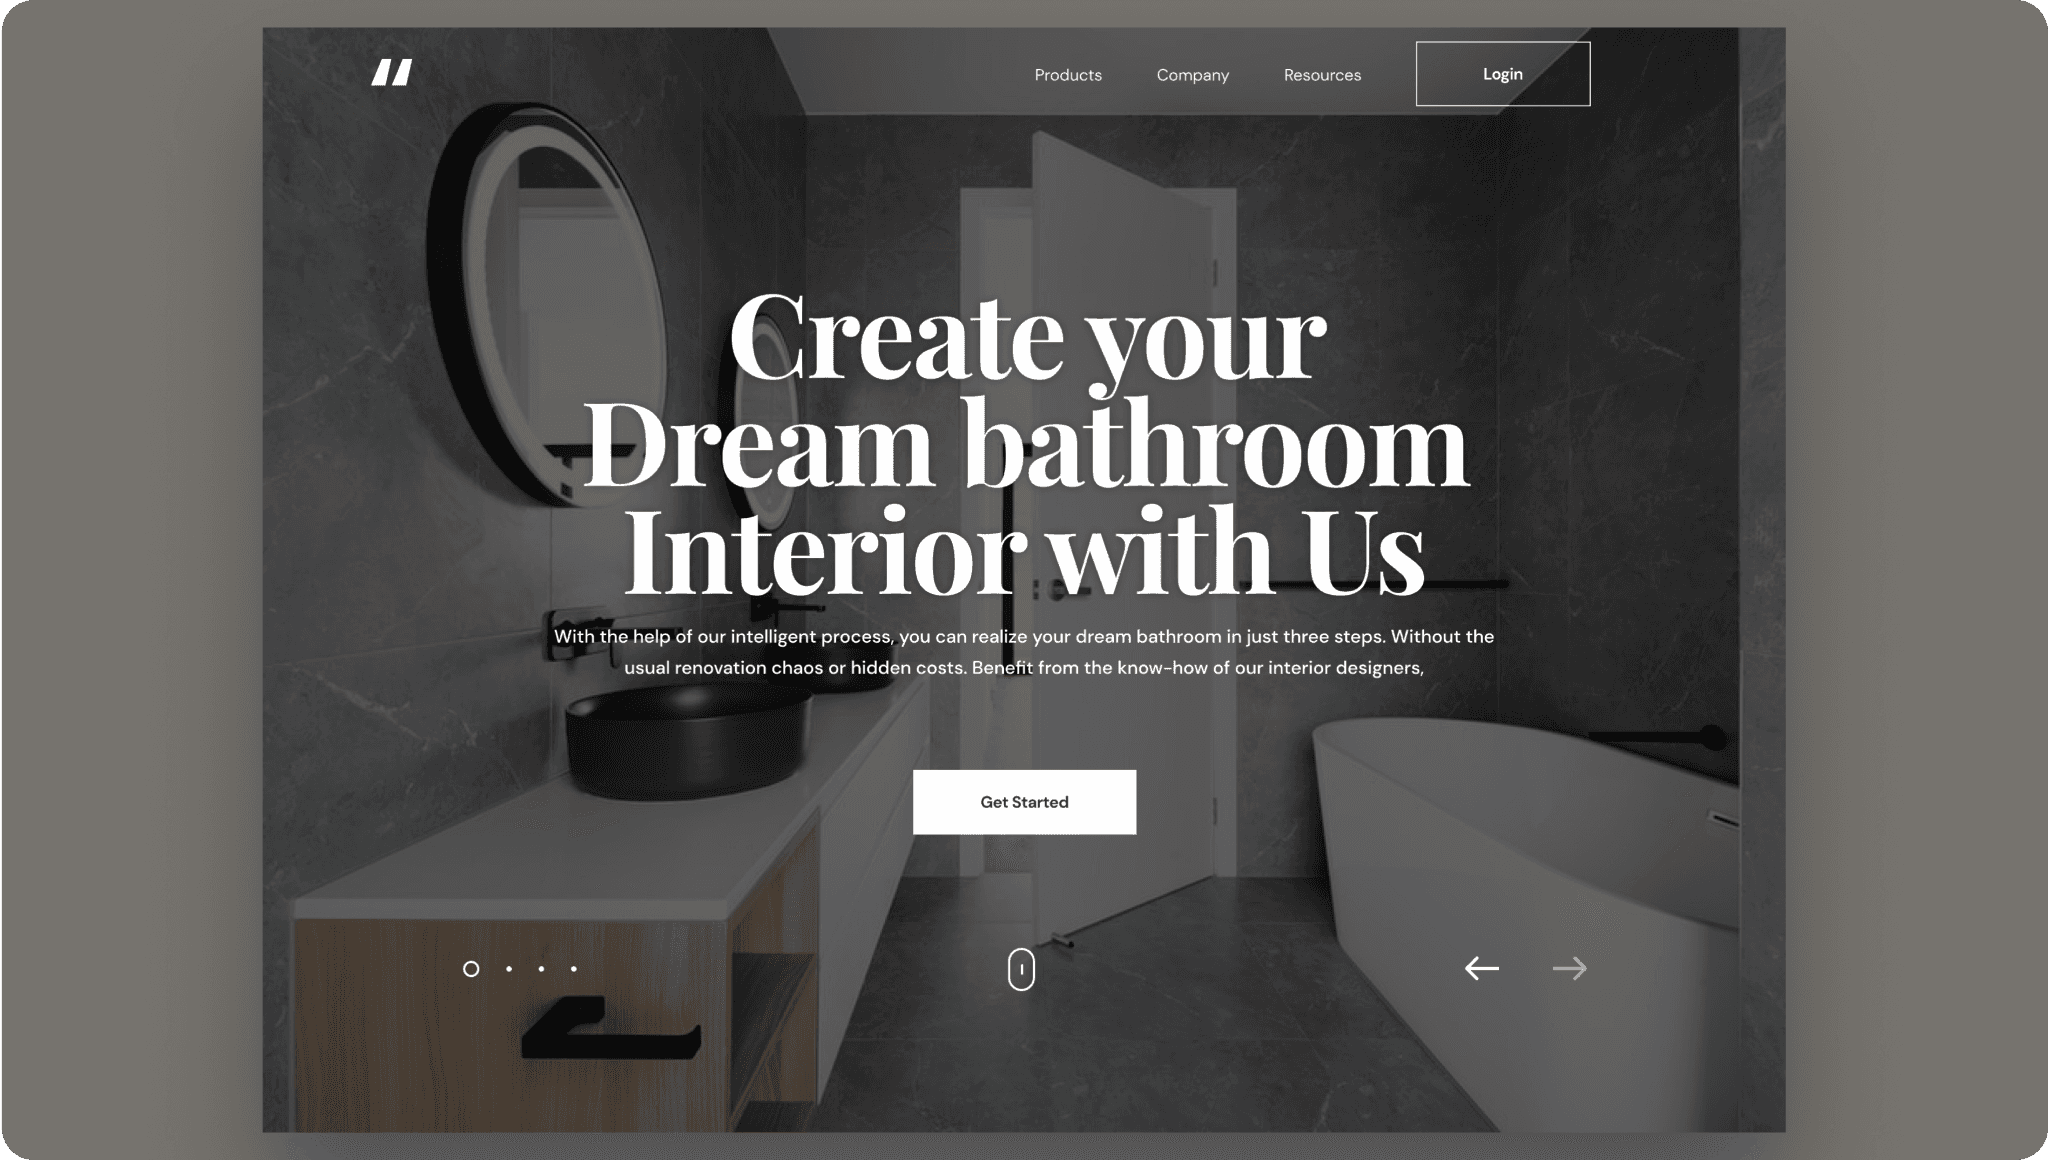
Lumen Dashboard was designed to simplify data visualization for businesses, providing actionable insights through a sleek and intuitive interface. This project focused on empowering users to make informed decisions with real-time analytics.
1
Weeks
5+
Screens
1
Designer
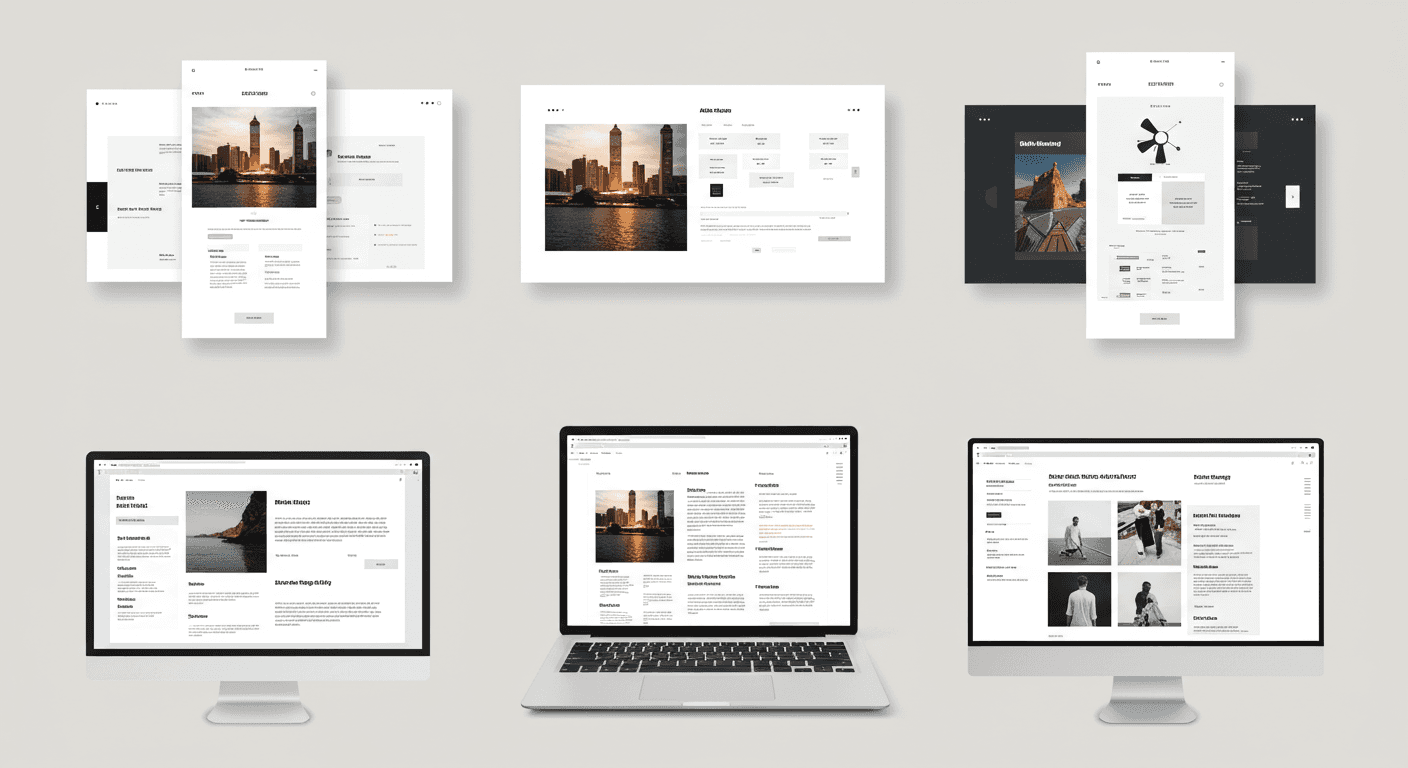
The key challenge was to create a dashboard that could present complex datasets in a way that was both visually appealing and easy to understand. It needed to accommodate users with varying levels of technical expertise while maintaining flexibility and scalability.
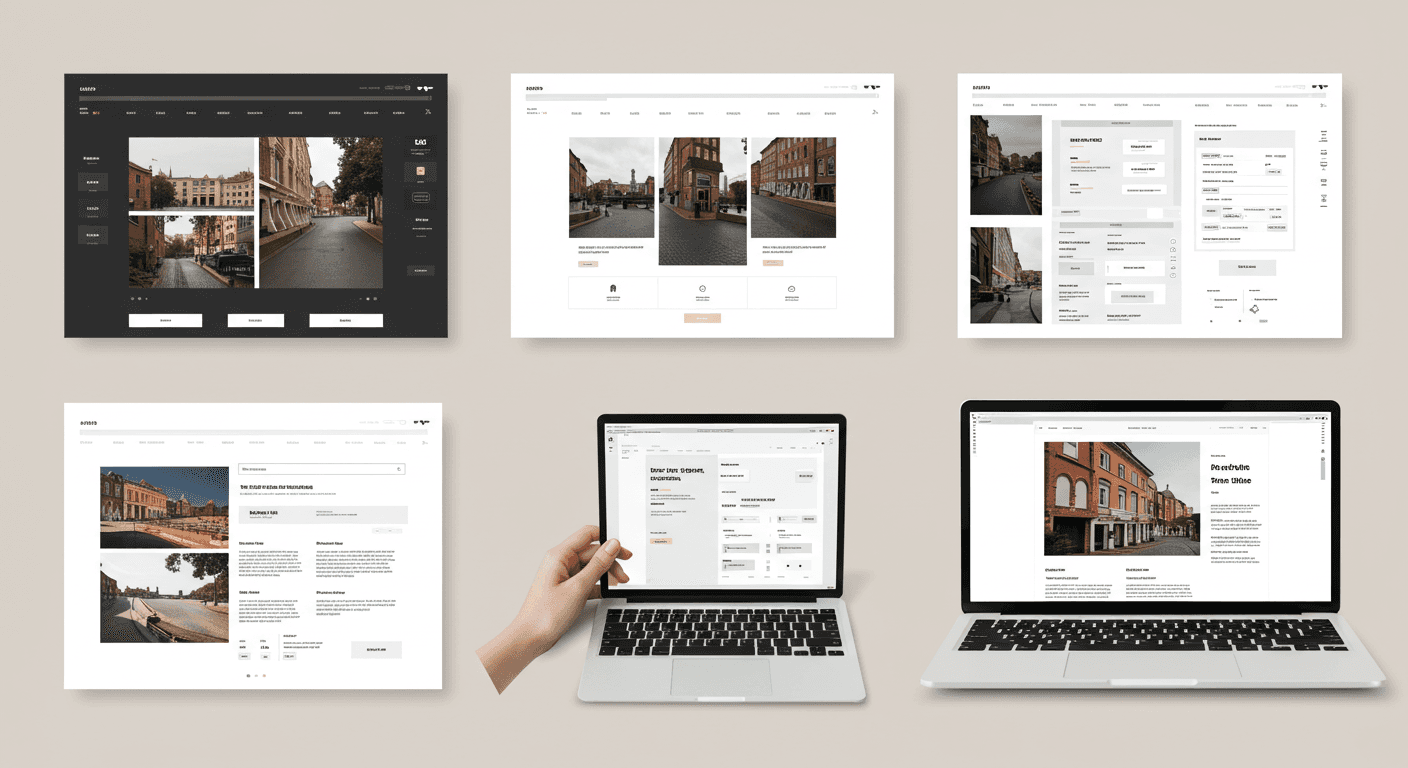
By implementing clean layouts, interactive charts, and customizable widgets, the Lumen Dashboard transformed how users interacted with their data. The design prioritized clarity and accessibility, ensuring even the most intricate metrics were easy to interpret.

The Lumen Dashboard exceeded expectations, reducing data analysis time by 35% for users. Client feedback highlighted its intuitive design, with an 80% increase in user adoption compared to the previous system. The project successfully turned data into a powerful tool for business growth, setting a new standard for user-friendly analytics platforms.